Cubo Ver.3
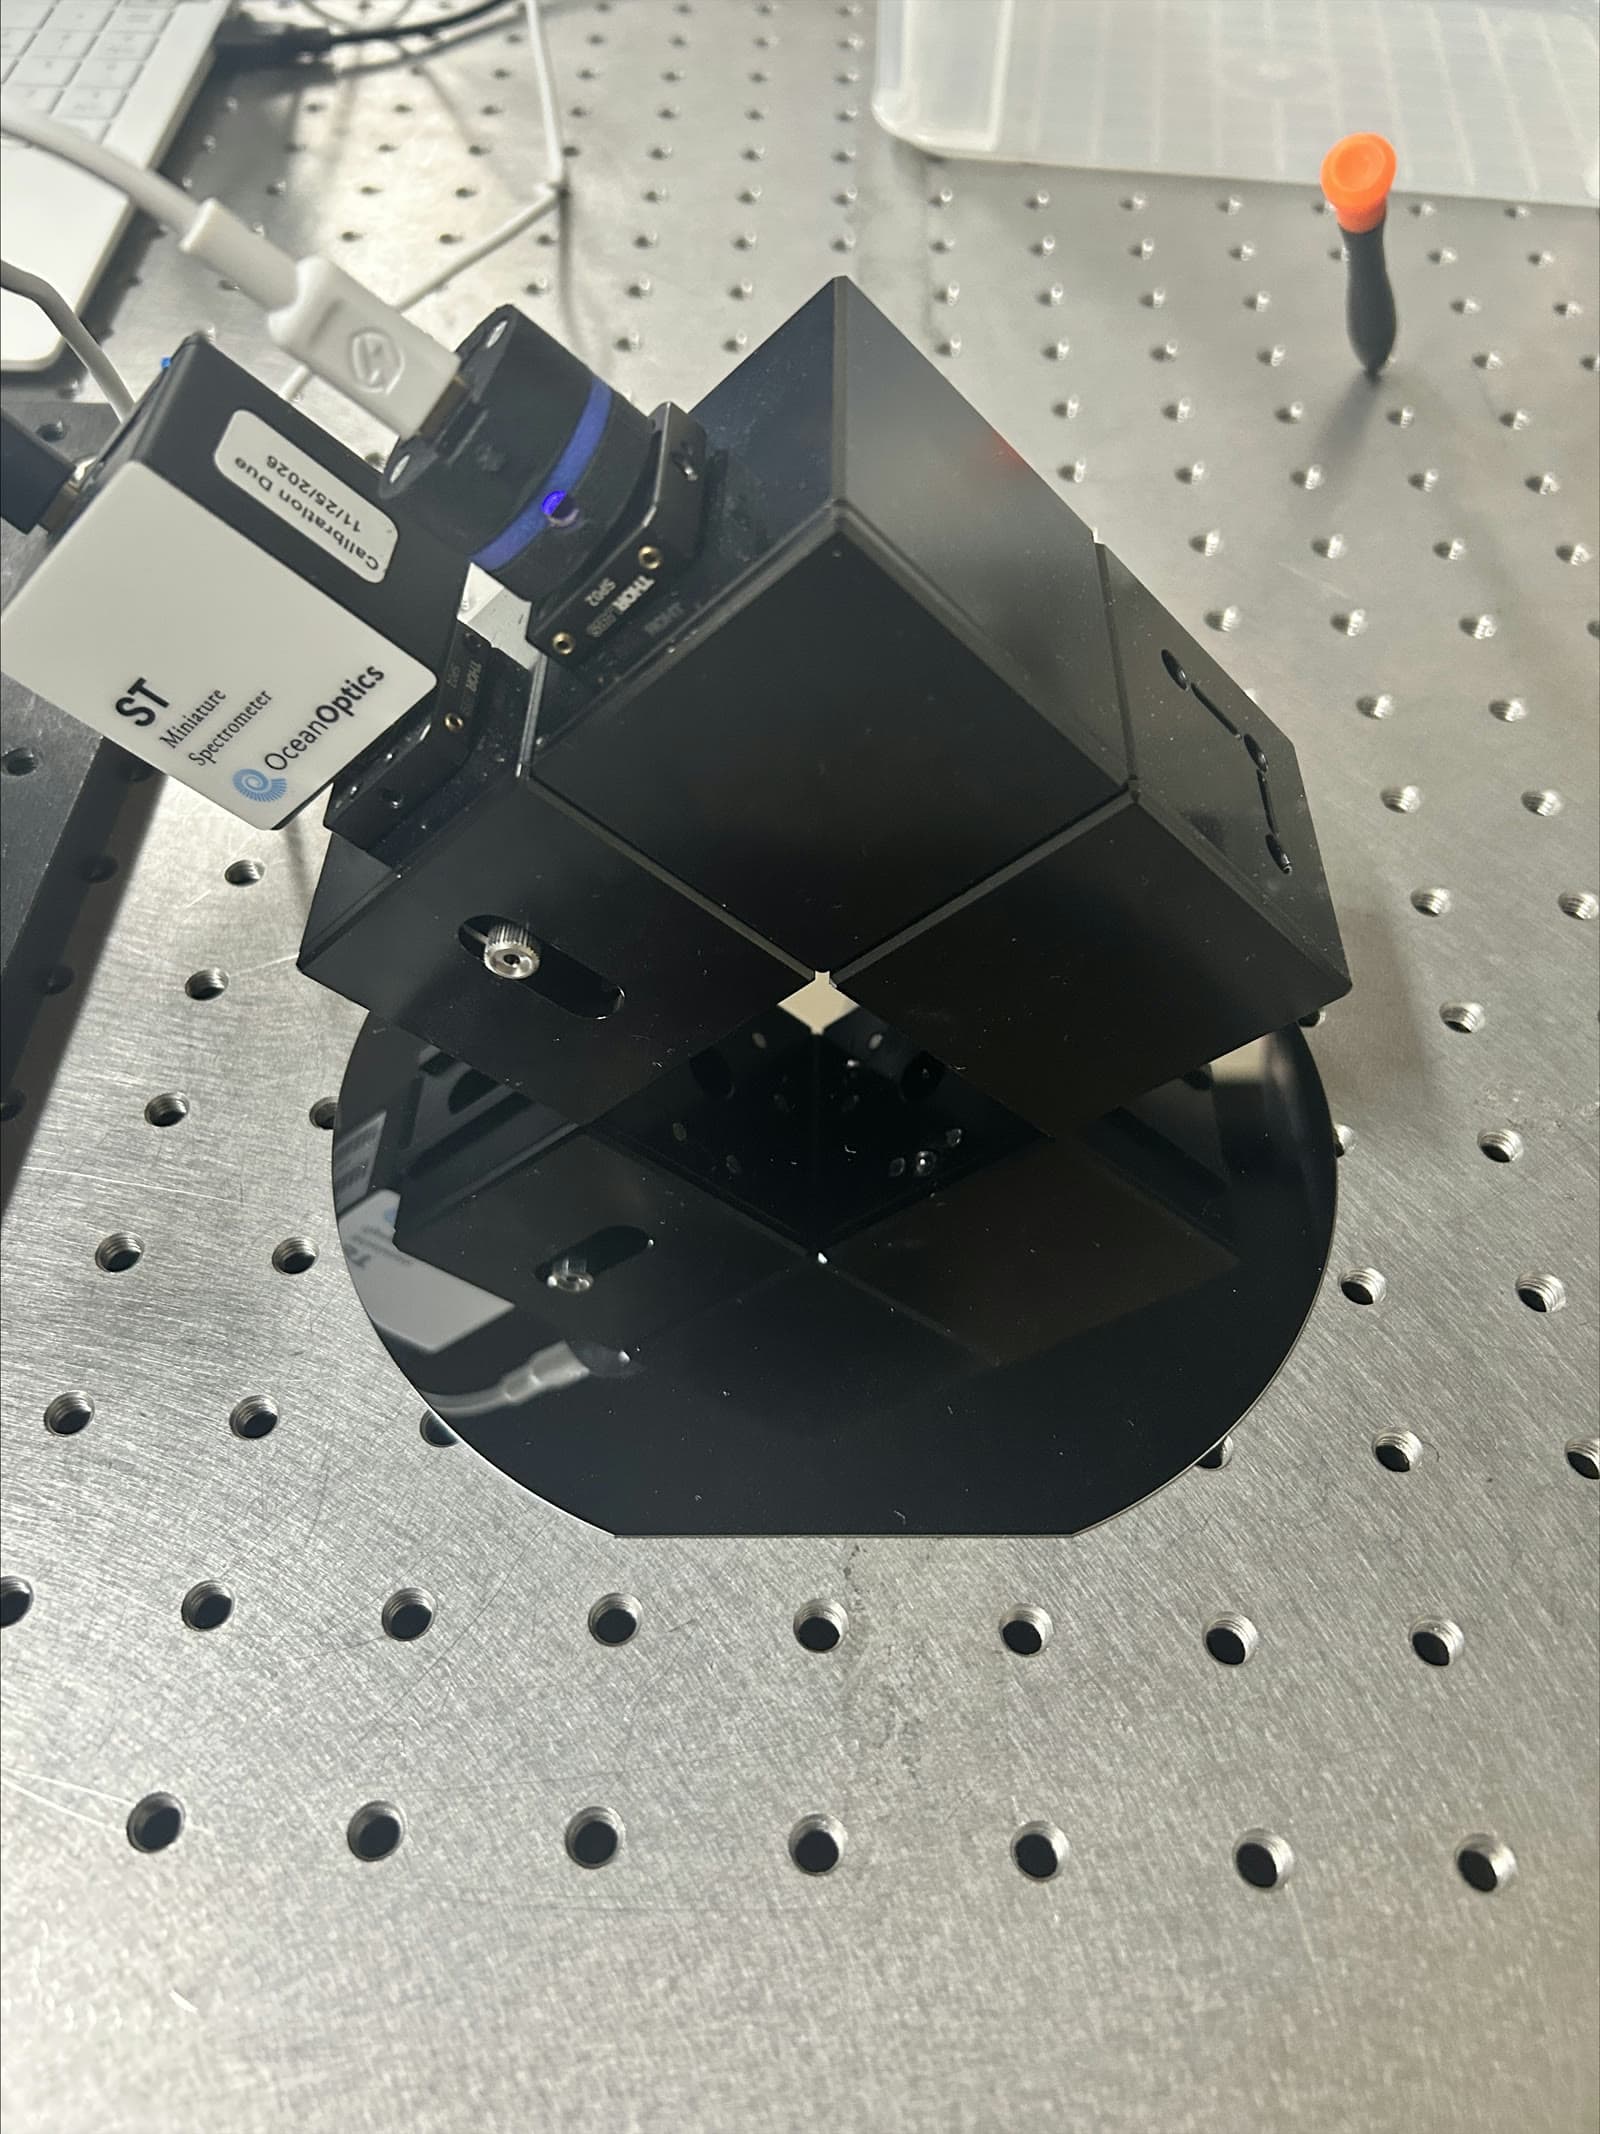
A real-time spectroscopic ellipsometer built from magnetically coupled optical cubes and a spectrometer. Assemble it and measure — no alignment procedure.
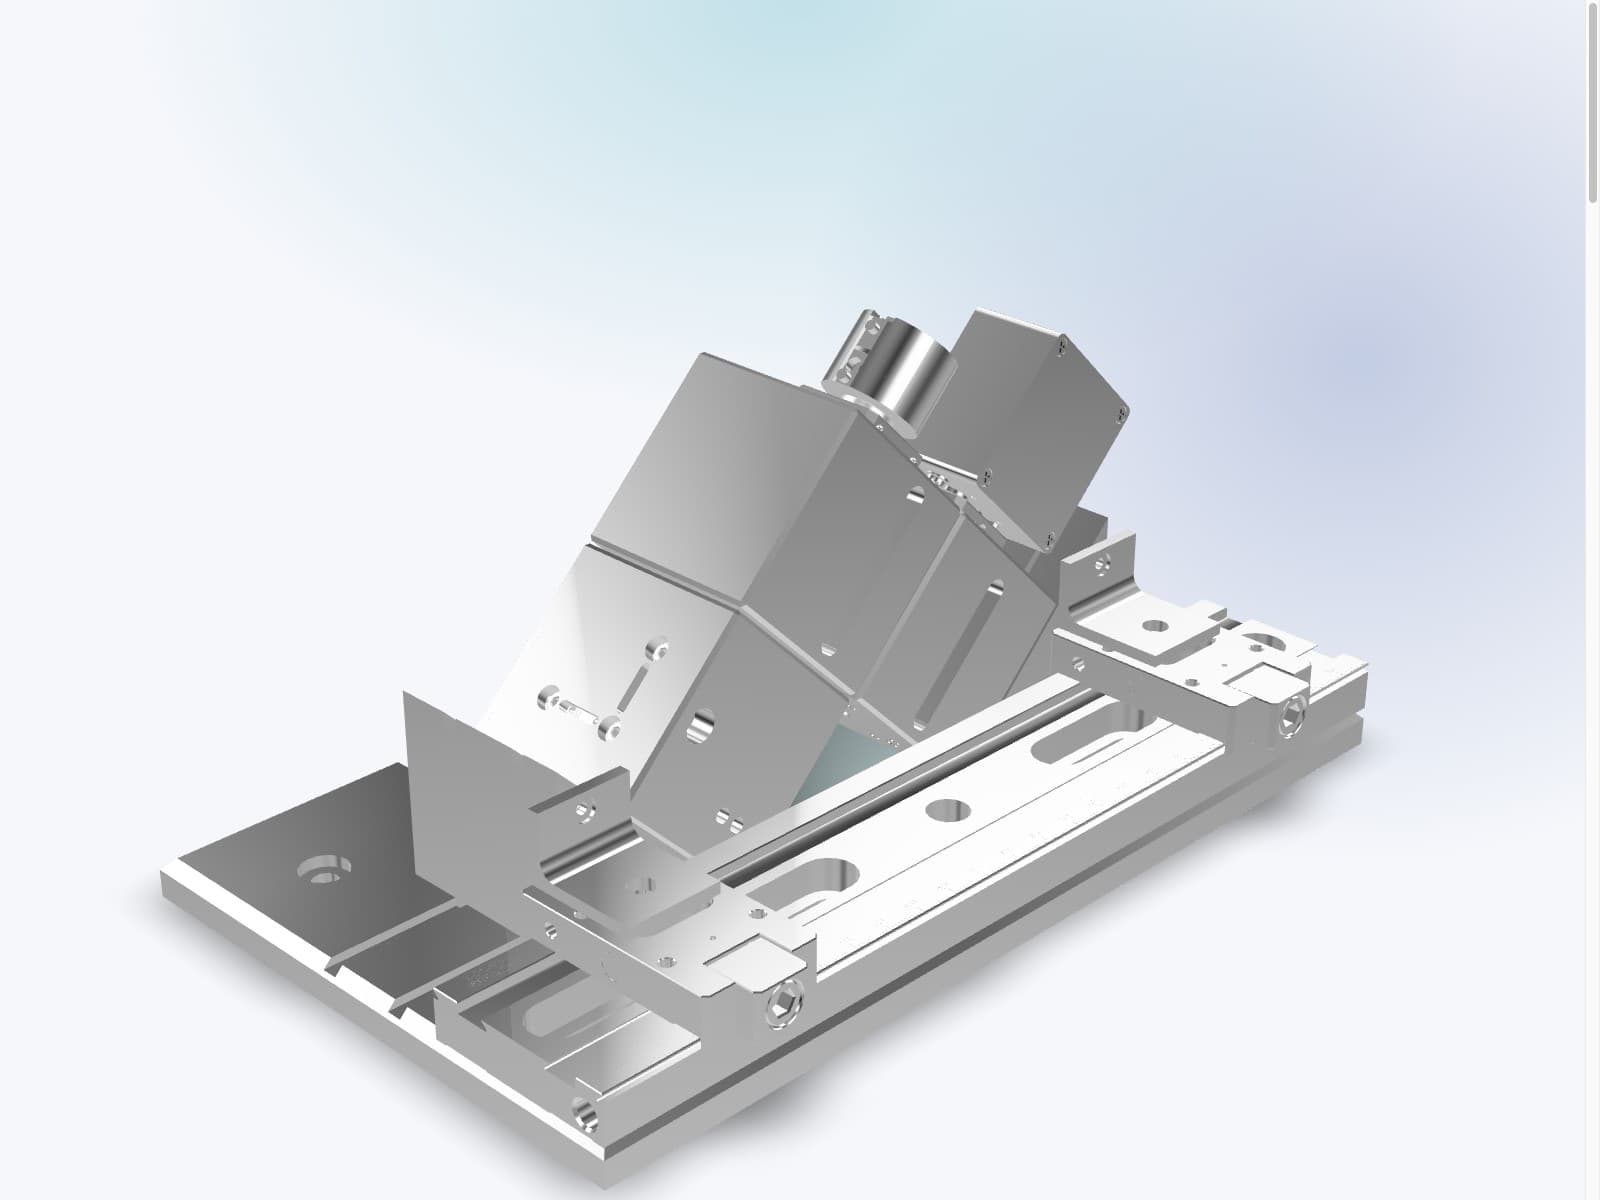
Explore in 3D
Drag to rotate.
Loading the 3D model.
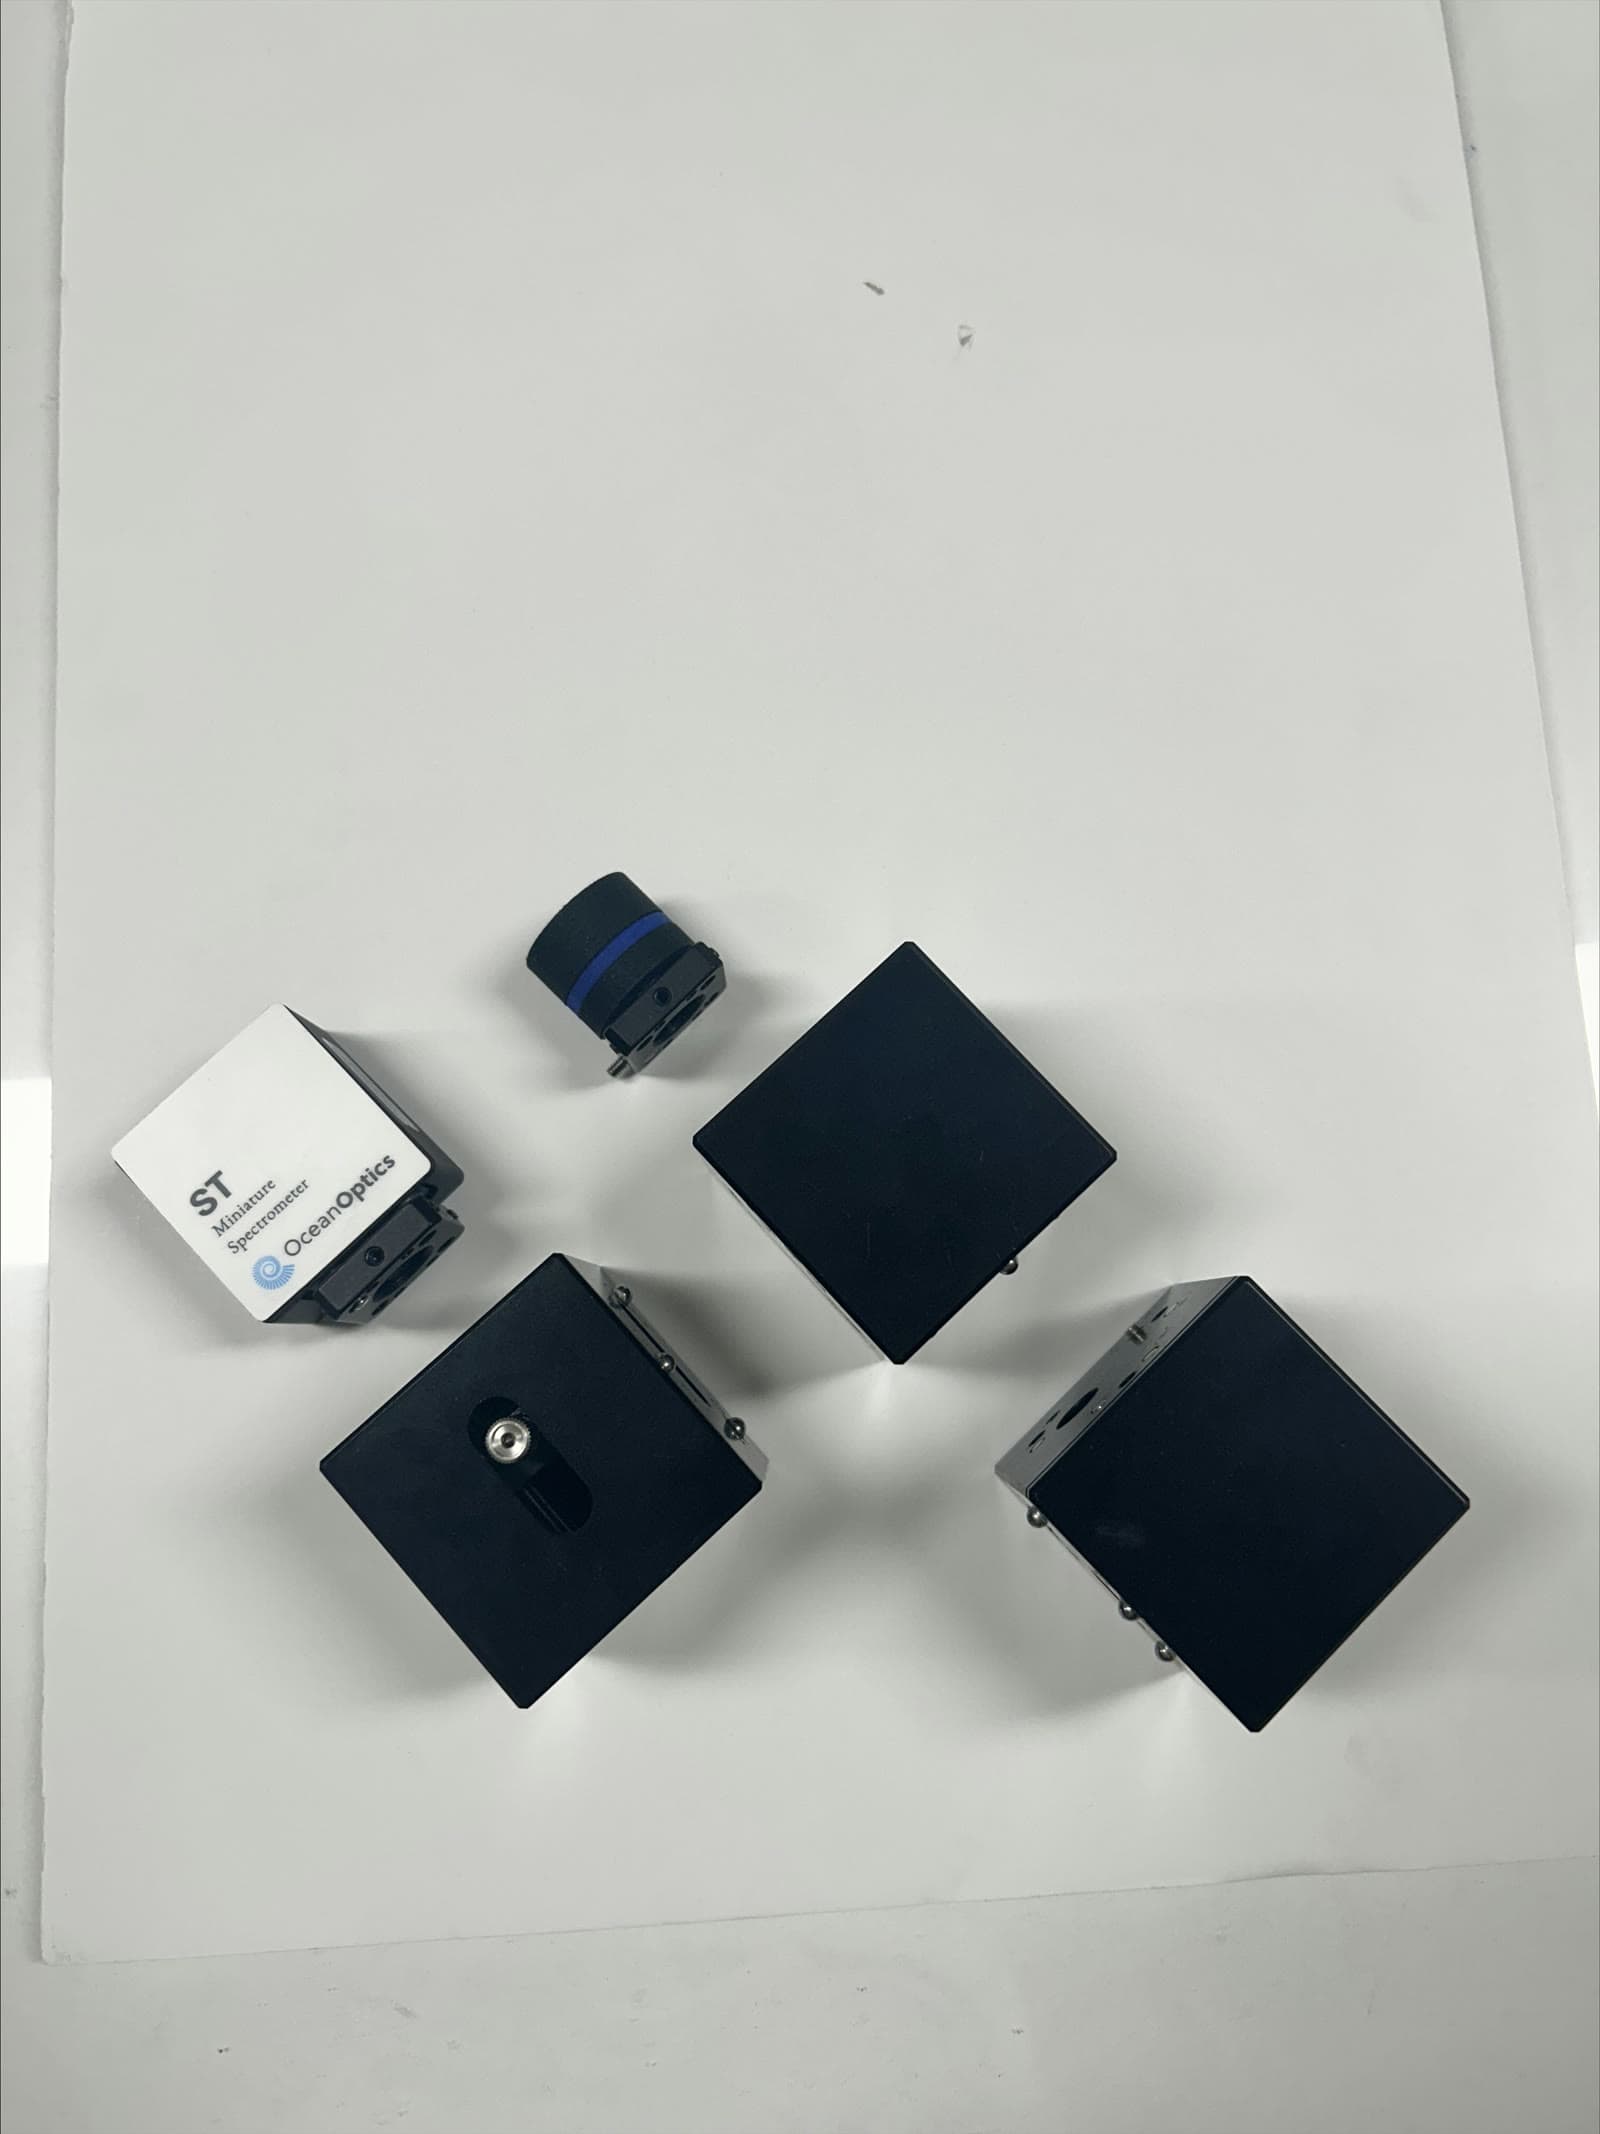
Modules
- Collimation
- Collimates the white-light source and directs the beam onto the sample.
- MPI
- The monolithic polarizing interferometer, with polarizers inserted at 0° and 90°. It creates the carrier frequency needed for phase extraction and, being one solid body, holds that frequency stable.
- Analyzer
- Relays the polarization interference signal reflected from the sample to the spectrometer.
- Magnetic coupling
- Modules couple with magnets and alignment balls instead of rods, so optical alignment survives repeated disassembly and reassembly.
Specifications
Every value below is verified by measurement. Capabilities still under development are listed separately in the roadmap on the Technology page.
Measurement
| Measured parameters | Δ (phase difference), Ψ (amplitude ratio) |
|---|---|
| Acquisition rate | > 20 HzContinuous acquisition — no moving parts |
| Δ precision | < 0.1° |
| Thickness repeatability | STD 0.4 nmOn 1472 nm SiO₂, over 20 minutes of continuous measurement |
| Wavelength range | 493.8 – 679.6 nm |
| Angle of incidence | 45°, fixed |
| Validated material | SiO₂ on SiSi₃N₄, Al₂O₃ and PR libraries are planned for launch |
System
| Sensor unit | 141 × 50 × 105 mm |
|---|---|
| With stage | 250 × 150 × 116 mm |
| Sample | 4-inch wafer |
| Moving parts | None |
| Module coupling | Magnets with alignment balls |
| Optical scheme | Monolithic Polarizing Interferometer (MPI) |
Software
| GUI | Python (MATLAB also supported) |
|---|---|
| Analysis | FFT phase extraction, multilayer thin-film fitting |
| Fit parameters | Thickness, AOI, offset |
| Data export | .txt (raw / fit) |
| Compute platform | Windows laptop or Linux edge device |
Software
A Python GUI takes you from connecting the spectrometer to extracting thickness in a single window.
- 01Connect the spectrometer and check the signal
- 02Inspect the raw spectrum and set the measurement range
- 03Window the AC term on the FFT plot
- 04Measure and store the reference wafer
- 05Measure the sample — Δ displayed live
- 06Fit thickness and angle of incidence, then export